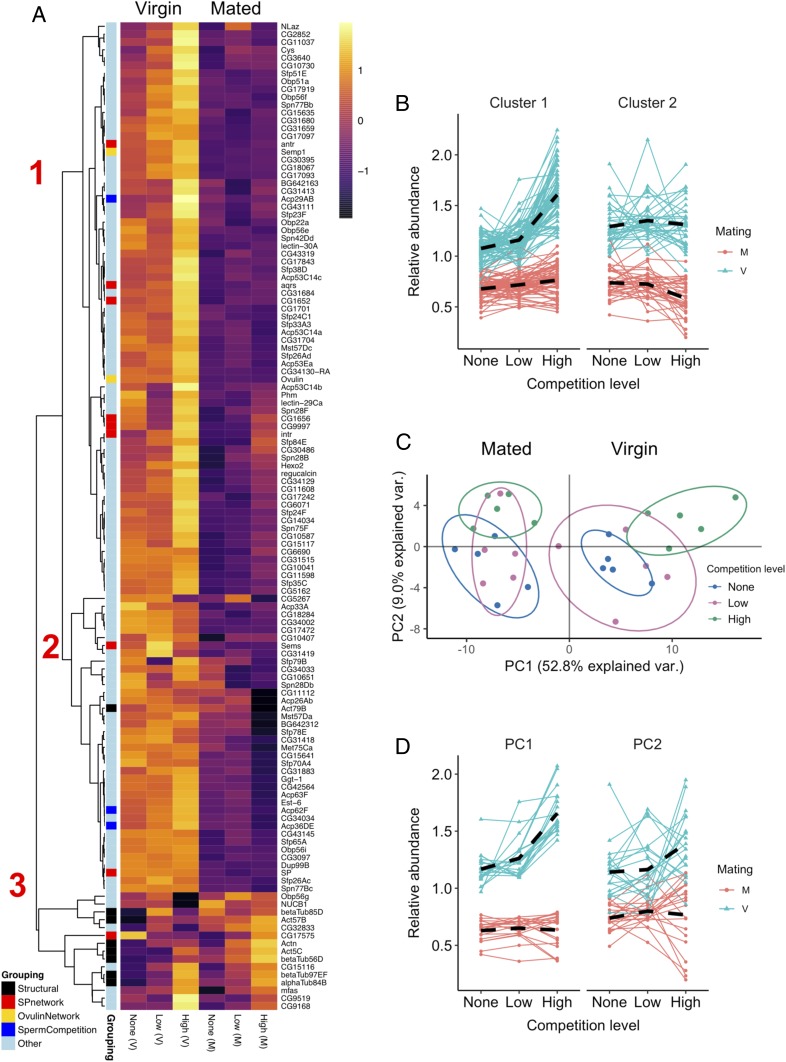
Fig. 2.
Seminal fluid protein production, transfer, and composition respond to competition intensity. Males were held alone (no competition), in a same-sex pair (low competition), or in a same-sex group of 8 (high competition) before being mated or retained as virgins. (A) Heatmap showing the abundance of 119 detected SFPs and 8 structural proteins detected in accessory glands. Each cell gives the across-replicate mean for that protein in a given treatment combination. From left to right, columns 1 to 3, virgins (V); columns 4 to 6, mated (M). Row annotations provide functional information relating to whether a protein is structural, functions as part of the sex peptide or ovulin networks, or has another known role in sperm competition (54–59, 94). Pearson correlation was used as the distance metric for the hierarchical clustering. Red numbers denote higher-order clusters referenced in the main text. (B) Abundance patterns of SFPs in the two major clusters identified in A. Each SFP is plotted separately in virgin (blue) and mated (red) glands. The dashed black lines give the mean abundance pattern across SFPs. Abundance values are relativized by means centering and averaging across replicates. (C) PCA biplot of detected SFPs. Points represent each of 30 samples colored according to competition treatment. Ellipses denote 80% normal probability. (D) Abundance pattern of the top 20 contributing SFPs to PC1 (Left) and PC2 (Right) determined in the PCA referred to in C and plotted following the approach in B.

