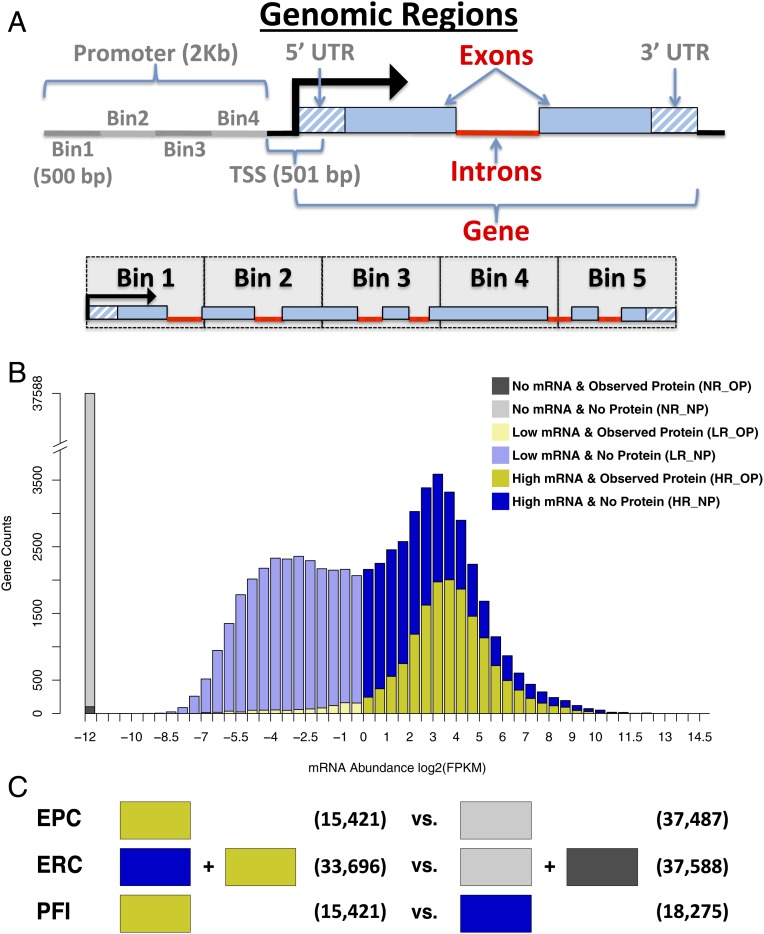
Fig. 1.
Overview of model features and training set definitions. (A) The various genomic regions where DNA methylation levels were quantified and used as features for classification. Features with gray labels were discarded after initial testing. Each gene was also split into 5 equivalent regions, called bins, and features were quantified separately in each bin. (B) The distribution of detected mRNA abundance is bimodal. The 2 mRNA populations can be roughly separated using an FPKM of 1. Here the nondetected mRNA (No mRNA) is represented as a separate population and given an artificial value of −12. Each population can be further refined into observed vs. nonobserved protein (No Protein) to yield 6 different groups of genes indicated by the different colors. LR_OP refers to all annotated genes that were observed to express low levels of mRNAs and detectable levels of proteins. (C) Three separate random forest models were built. Colored blocks correspond to the gene sets (from B) used for each training class. Blocks on the left indicate the positive (true) training instances vs. blocks on the right that indicate the negative (false) training instances. Numbers in parentheses indicate the number of genes in each training class.

