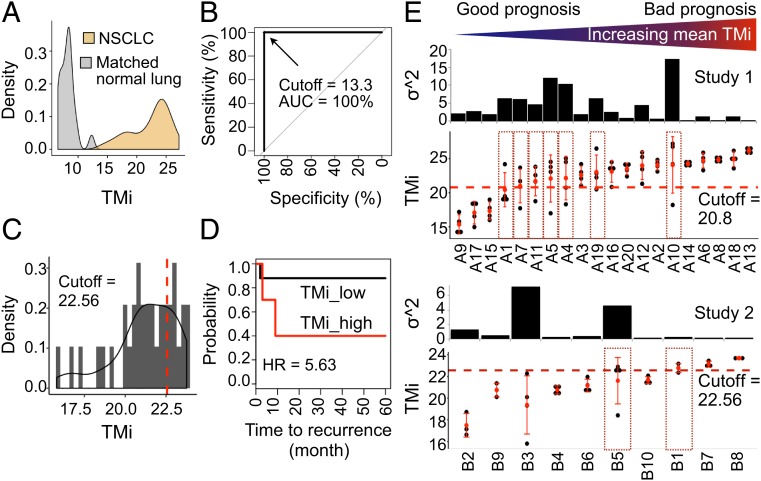
Fig. 1.
ITH-driven patient misclassification in lung cancers. (A) Density distribution of TMi in NSCLC (n = 80) and matched normal lung (n = 20) from study 1. (B) ROC curves using the best TMi cutoff value. (C) Gaussian kernel density distribution of TMi in tumor sectors (n = 35) from study 2. (D) Kaplan–Meier survival curves using the optimal cutoff value (95% CI = 1.4 to 22.7; log-rank P = 0.00628). (E) TMi distribution and the variance of TMi (σ2). The universal cutoff value and the optimal cutoff value were used for patient stratification in study 1 (Top) and study 2 (Bottom), respectively. Dotted red boxes represent discordant tumor samples with TMilow and TMihigh sectors. Patients are ordered by increasing mean TMi.

