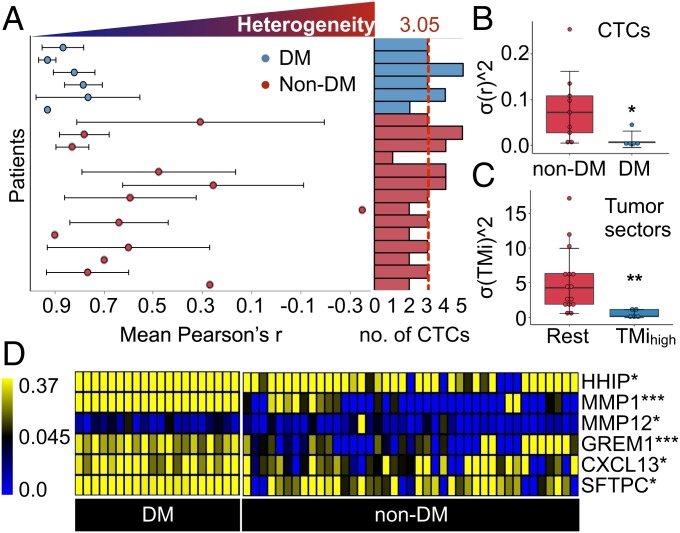
Fig. 3.
Potential predictors of distant metastasis or recurrence. (A) Heterogeneity in 15-gene matrisome expression (±SD) measured by mean Pearson correlation coefficient (r) across all CTCs detected within the same patient with (blue) or without (red) distant metastases (DM). Each clustered bar (Right) represents the number of analyzed CTCs. The vertical red dashed line represents the mean number of analyzed CTCs. (B and C) Intrapatient variability in matrisome gene expression in (B) liquid biopsies and (C) tumor tissues (***P < 0.001 and **P < 0.01, Wilcoxon rank-sum test). (D) Heat map comparing expression profiles of selected matrisome genes between DM and non-DM patient groups (***P < 0.001, **P < 0.01, and *P < 0.05, Wilcoxon rank-sum test).

