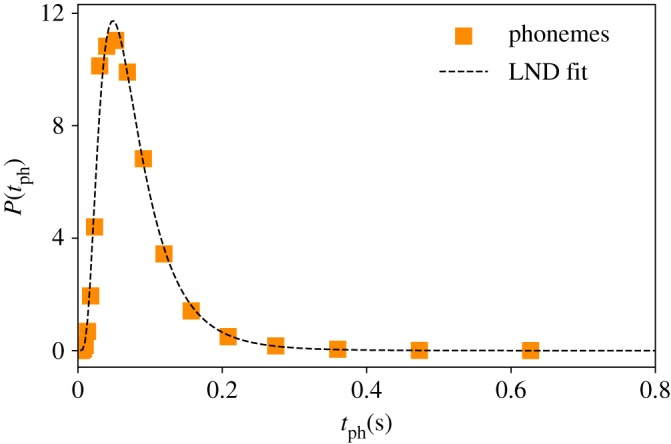
Figure 3.

Phoneme duration is lognormally distributed. Empirical time duration distribution of phonemes (orange squares) in the English Buckeye database. Black dotted line is a maximum likelihood estimation (MLE) fit to a LND, with MLE parameters (−2.68, 0.59) (see table 2 for goodness of fit and alternative fits).
