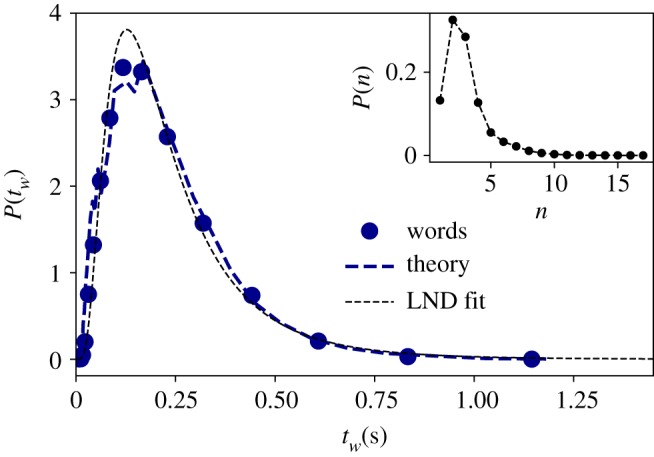
Figure 4.

Word duration is lognormally distributed. Empirical time duration distribution of words (blue circles) in the English Buckeye database. Black dotted line is the MLE fit to a LND distribution (see table 2 for goodness of fit). Blue dashed line is the theoretical prediction of equation (3.1) (see the text for details). (Inset panel) Estimated distribution of number of phonemes per word P(n) from which n is randomly sampled.
