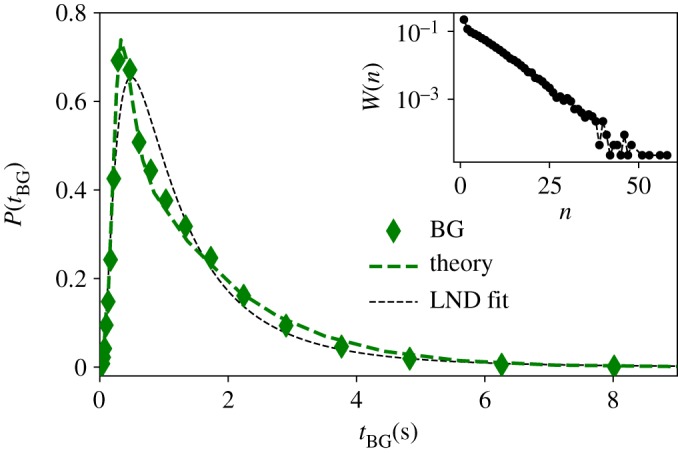
Figure 5.

BGs are lognormally distributed time duration distribution of all BGs (green diamonds) in the English Buckeye database. Black dotted line is the MLE fit to a LND distribution (see table 2 for goodness of fit). The green dashed line is the theoretical prediction of equation (3.1) where a Gaussian error term with positive mean is included to model for voice onset time (VOT; see the text for details). (Inset panel) Semi-log plot of the estimated distribution of number of words per BG W(n) from which n is randomly sampled in the theoretical model. Note that this distribution is exponential, suggesting that BG segmentation of the corpus is statistically compliant with a Poisson process.
