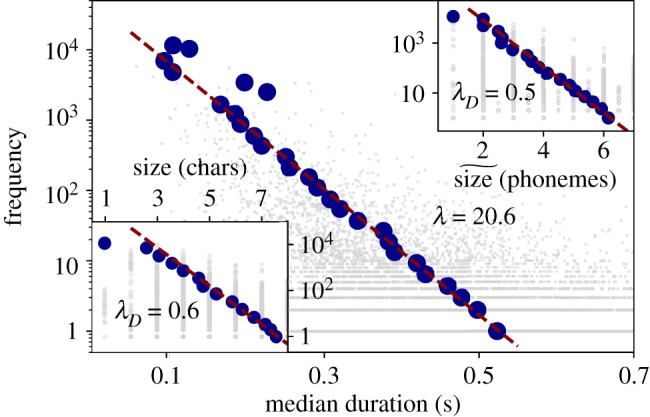
Figure 8.

Brevity Law: words. On the main panel, we display for each word (grey dots) the scatter plot between its median time duration (in seconds) and its frequency of occurrence. Blue circles are the result of applying logarithmic binning to frequencies (see the text and electronic supplementary material for details). Upper right panel shows the same relationship but considering the median number of phonemes per word, while bottom left panel represents the number of characters per word. All panels are semi-log plots. Spearman test S systematically shows strong negative correlation slightly higher for time duration (S ∼ −0.35) than for symbolic representation of phonemes and characters (S ∼ −0.26) (a two-sided p-value for a hypothesis test whose null hypothesis is that two sets of data are uncorrelated provides p-value ≪ 10−3 in all the cases, i.e. safely rejecting the null hypothesis of uncorrelation), supporting the Zipf’s Law of abbreviation in every case. Data in the inset panels are then fitted to theoretical equation (3.4), whereas data in the main panel is fitted using theoretical equation (3.5). In every case, there is a remarkable agreement between the theoretical equations (which fit the grey dot data) and the binned data.
