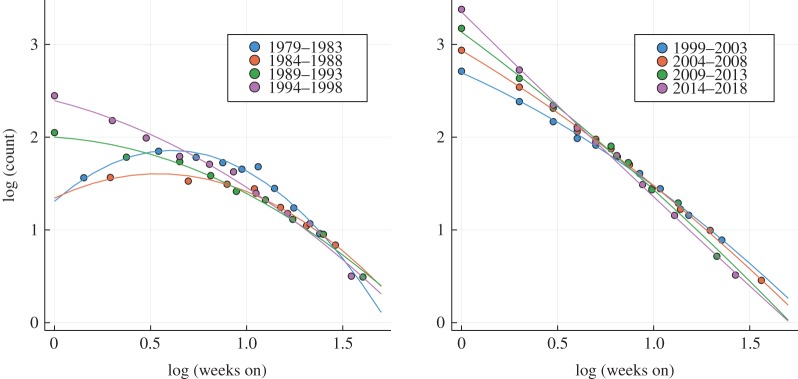
Figure 3.
Lifetime distribution. On a basis 10 log-log plot, the top 40 lifetime distribution, namely the distribution of the number of weeks a given album is listed among the top 40 on the Billboard chart. The data (circles) have been pooled for successive 5-year periods and fitted quadratically (lines), compare (2.1). One observes that the lifetime distribution evolves over the years from a log-normal distribution towards a power law, which corresponds, respectively, to a quadratic and a linear dependency in a log-log representation.

