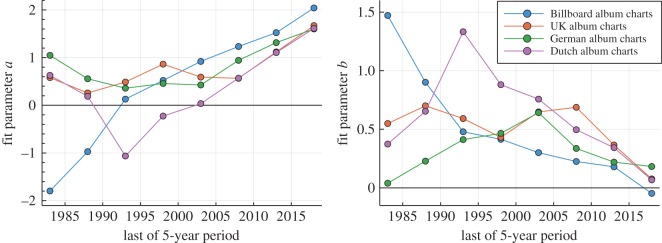
Figure 4.
Coefficients of the lifetime distribution fits. The time evolution of the fit parameters a (left panel) and b (right panel) for the top 40 album lifetimes (circles), which correspond to the number of weeks nw an album is listed among the top 40. The lifetime distribution has been fitted by exp (−a ln(nw) −b ln2(nw)), as illustrated in figure 3 for the Billboard charts. This functional form corresponds to a log-normal distribution for b > 0 and to a power law for b → 0. The data are for trailing 5-year periods. Over time, the lifetime distribution becomes more power law-like, with the exponent a approaching the marginal value a → 2. For the German music charts, the trend is less clear. The lines are guides to the eye.

