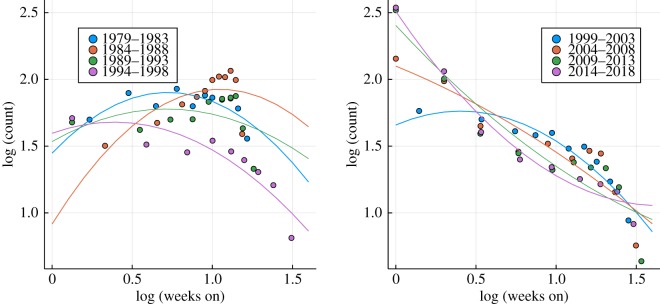
Figure 8.
Single lifetimes. On a basis ten log-log plot, the top 40 lifetime distribution for the Billboard single charts, which are based in part on airplay data. Included are, as for figure 3, least-square quadratic fits, which correspond to log-normal and power-law distributions (2.1). It is evident that the single lifetime distribution cannot be approximated faithfully by log-normal distributions or power laws.

