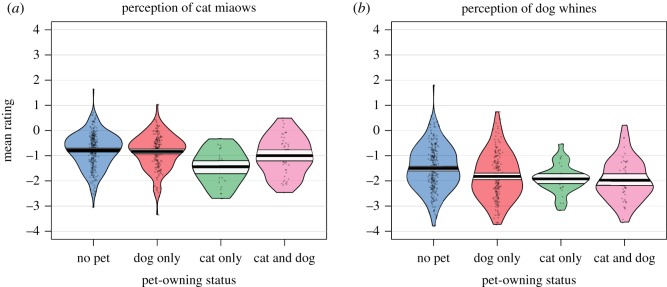
Figure 2.
Pirate plot presenting valence ratings from the four participant groups for (a) cat and (b) dog vocalizations. (a) Cat-owners rated cat miaows significantly more negatively than all the other groups. (b) All pet-owners (dog only, cat only, cat and dog) rated the dog whines significantly more negatively than those who did not own pets. Raw data are represented by the black dots, the horizontal bar represents the mean, the coloured regions show smoothed densities and the rectangle shows the confidence intervals.

