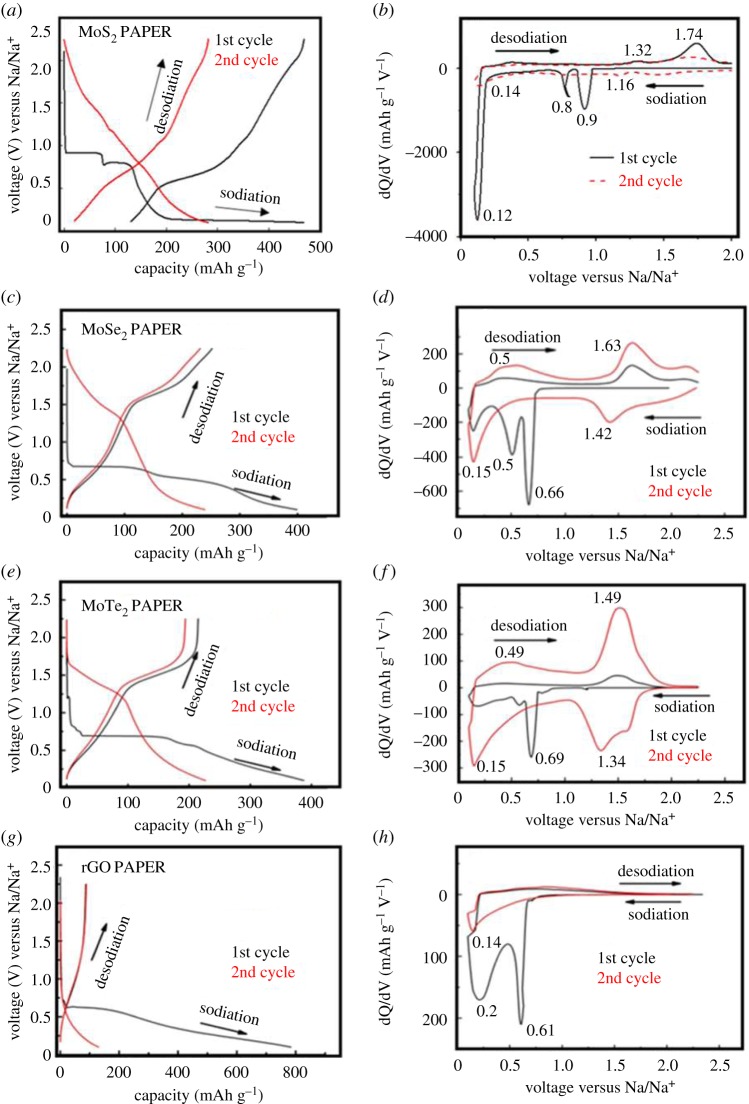
Figure 6.
Electrochemical performance of TMD composite electrodes in Na/Na+ half-cell. (a,c,e,g) are the GCD curves of the first and second cycles for the MoS2, MoSe2, MoTe2 and rGO electrodes demonstrating their characteristic behaviour towards Na+ ion interaction, (b,d,f,h) are the corresponding dQ/dV plots of the composite TMD electrodes exhibiting the characteristic sodiation and desodiation peaks. (1 mAh g−1 = 3.6 C g−1). Permission for reuse of data for figures (b,g,h) obtained from ACS publications [23].

