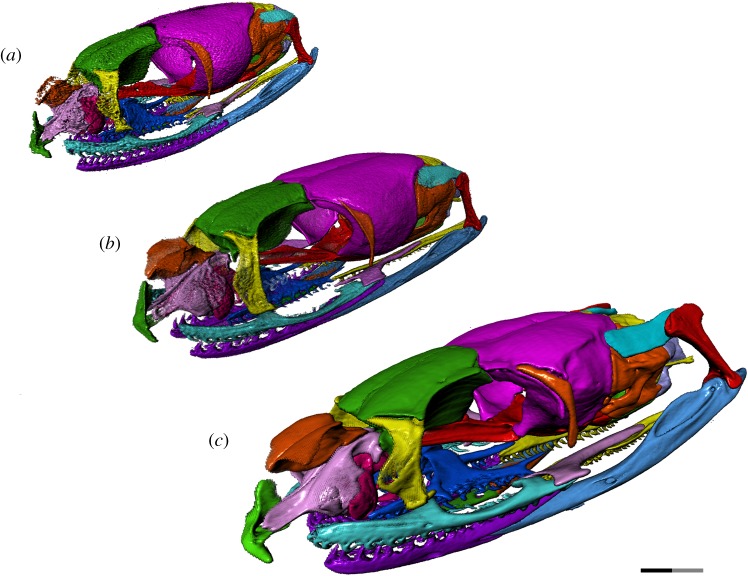
Figure 1.
Left anterolateral view of T. radix skull throughout ontogeny: (a) embryo; (b) juvenile; (c) adult. Note: full length of scale bar equals 2 mm; black and grey portions of scale bar each equal 1 mm. Surface mesh (STL) files for each individually segmented bone in each stage are available in the electronic supplementary material given in [15].

