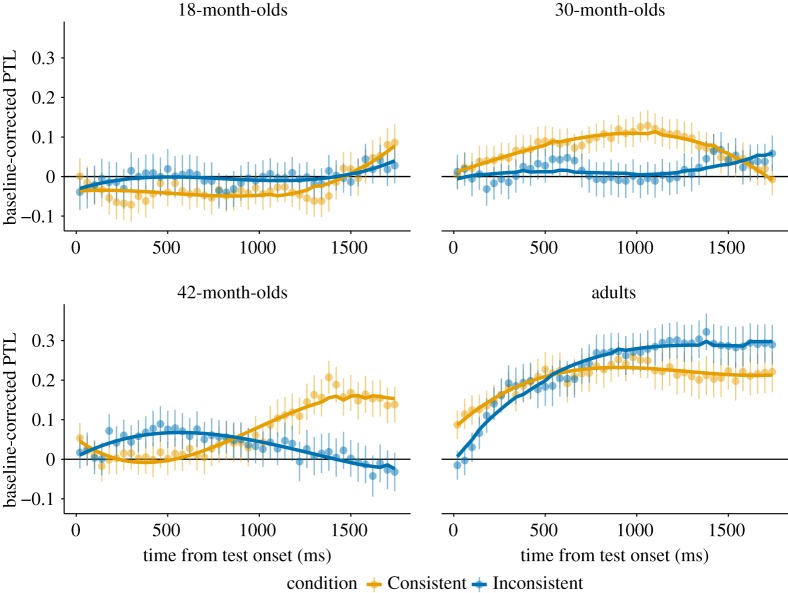
Figure 5.
Time course graphs for each age group of participants’ baseline-corrected proportional target looking (PTL) during the test phase after label onset at 2500 ms and 240 ms to initiate a fixation. The Consistent condition is represented in yellow, the Inconsistent condition is in blue. The line at 0 represents chance level, increases reflect proportionally more target looking whereas decreases reflect distractor looking. The yellow and blue lines reflect the fitted GLMM including time up to the cubic term for each condition.

