Fig. 1.
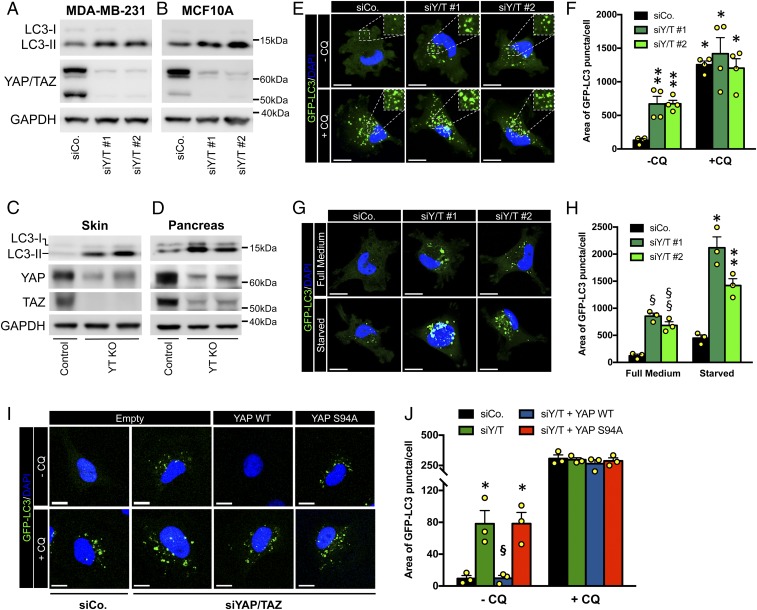
YAP/TAZ control autophagic flux by regulating autophagosome degradation. (A and B) Immunoblot analysis for YAP/TAZ and LC3 in MDA-MB-231 (A) and MCF10A (B) transfected with control siRNA (siCo.) or 2 independent YAP/TAZ siRNA mixes (siY/T #1 or siY/T #2) for 48 h. The cleaved LC3 peptide and its phosphatidylethanolamine conjugated form are indicated as LC3-I and LC3-II, respectively. GAPDH serves as loading control. (C and D) R26CAG-CreER; Yapfl/fl; Tazfl/fl mice carrying an ubiquitous inducible Cre recombinase were treated with tamoxifen to obtain the knockout of both YAP and TAZ floxed alleles in vivo (Yap−/−; Taz−/−; i.e., Y/T KO). Tamoxifen-treated Yapfl/fl; Tazfl/fl littermate mice (without CRE) were used as control. See also SI Appendix, Methods. Immunoblot analysis of lysates from skin (C) and pancreatic biopsies (D) shows increased levels of LC3-II in YAP/TAZ knockout mice, compared to their controls (Top). Knockout of YAP and TAZ was confirmed by Western blot (Middle). Residual YAP and TAZ proteins remain in these blots due to cells escaping recombination. GAPDH serves as loading control (Bottom). (E and F) MDA-MB-231 cells stably expressing GFP-LC3 construct (MDA-GFP-LC3) were transfected with control siRNA (siCo) or 2 independent YAP/TAZ siRNA mixes (siY/T #1, siY/T #2) for 48 h. Cells were treated with medium (−CQ) or CQ 50 μM (+CQ) for the last 4 h. E shows representative confocal images. The Insets (2×) show higher magnification of the GFP-LC3 puncta. DAPI (blue) is a nuclear counterstain. (Scale bar, 20 μm.) (F) Quantification of GFP-LC3 puncta accumulation, measured as area of GFP-LC3 puncta per cell. Bars represent mean + SEM from 4 independent experiments. (*P ≤ 0.0001, **P < 0.05, compared to −CQ siCo; 2-way ANOVA). See SI Appendix, Methods for detailed GFP-LC3 quantification method. (G and H) MDA-GFP-LC3 cells transfected as in E, were cultured in full nutrient medium (full medium) or subjected to nutrient starvation in Hank's balanced salt solution (HBSS; starved) for the last 4 h. (G) Panels are representative confocal images. (H) Quantification of GFP-LC3 puncta accumulation as in F. Bars represent mean + SEM from 3 independent experiments (§P < 0.05, §§P < 0.01, compared to full medium siCo; *P < 0.0001, **P < 0.001 compared to starved siCo; 2-way ANOVA). (I and J) MII cells stably expressing GFP-LC3 construct (MII-GFP-LC3) were infected with an empty lentiviral vector (empty) or with the indicated siRNA-insensitive doxycycline-inducible lentiviral Flag-tagged YAP constructs. Cells were transfected with either control (siCo) or YAP/TAZ siRNAs (siYAP/TAZ), treated with doxycycline and analyzed 48 h after siRNA transfection. Cells were concomitantly treated with or without CQ for the last 4 h. (I) Panels are representative confocal images. (Scale bar, 20 μm.) (J) Quantification of GFP-LC3 puncta as in F. Bars represent mean + SEM (*P < 0.01 compared to −CQ empty-infected siCo, §P < 0.01 compared to −CQ empty-infected siYAP/TAZ; 1-way ANOVA). See also SI Appendix, Fig. S1G for validation of YAP/TAZ transcriptional activity in I and J.

