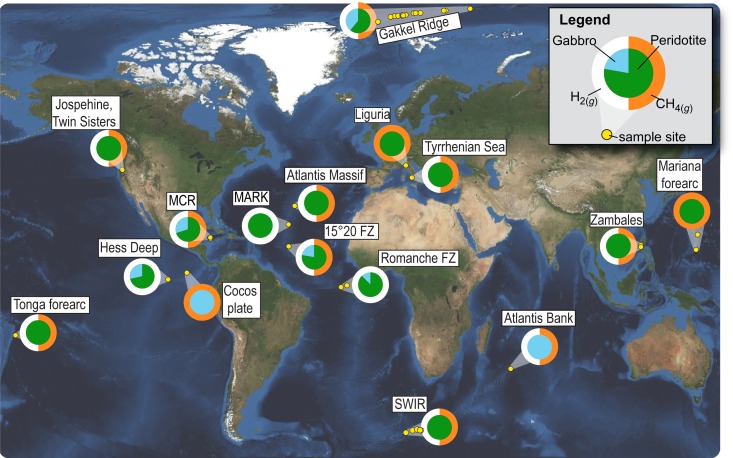
Fig. 1.
Map showing the distribution, host rock type, and volatile contents of samples examined in this study. Note that inner circle of pie chart indicates proportions of olivine and gabbro whereas the color of the outer circle indicates the presence (or absence) of H2(g) (white) and CH4(g) (orange).

