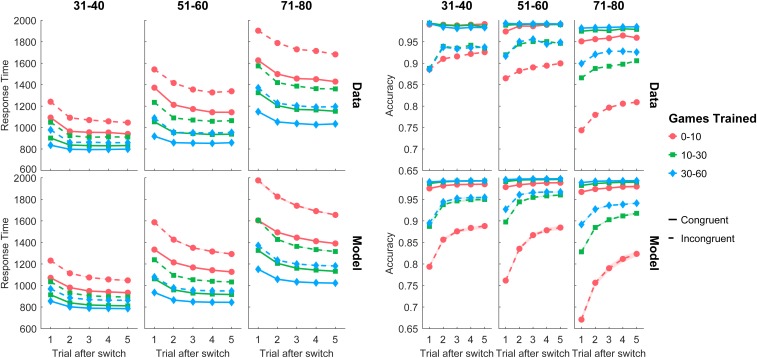
Fig. 3.
Average response time and accuracy for observed data (Upper) and model predictions (Lower) for the first 5 trials following a task switch, broken down by age group (columns), levels of practice (colors), and congruency (solid line, congruent; dashed line, incongruent). Shaded areas for model predictions represent 75% credible intervals. Runs extending beyond 5 trials were included in the modeling, but are not shown here.

