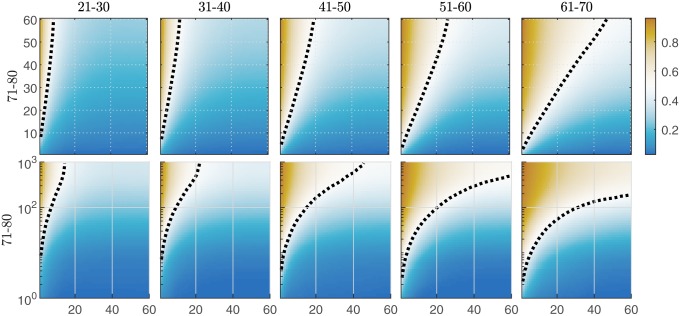
Fig. 6.
Performance comparison as a function of practice for the older (vertical axes) and the younger (horizontal axes) age groups. Dark orange colors indicate practice levels where the majority of older individuals are outperforming the younger individuals; dark blue colors indicate the opposite. Dashed lines show the practice levels resulting in equal odds of an older individual outperforming a younger individual. Upper compares users with training data up to 60 games. Lower compares the performance of older users with training data up to 1,000 games (36 per age group) against younger users with training data up to 60 games. The performance metric is the speed of task switching ().

