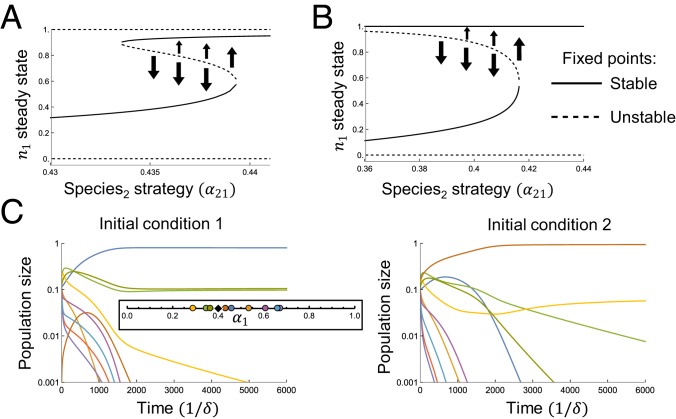
Fig. 5.
(A and B) Two species competing for 2 nutrients, with supply and . Arrows indicate flow away from unstable fixed points. (A) Bistability for . (B) Allee effect for . Species 2 goes extinct if its initial population is too low. (C) The Allee effect in a competition with 10 species and 2 nutrients, with and . The blue and brown species displace each other, depending on initial conditions. (Inset) Strategies and supply.

