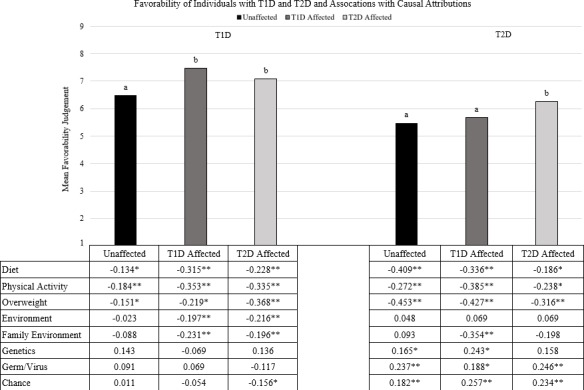
Figure 4.

Favorability means (graph, scale 1–9) and associations between causal factor and favorability (table, unstandardized B values). *P<.05. **p<.01 by row, within T1D or T2D. Bars that share a letter within each diabetes type are not significantly different from one another at p<.05. T1D, type 1 diabetes; T2D, type 2 diabetes.
