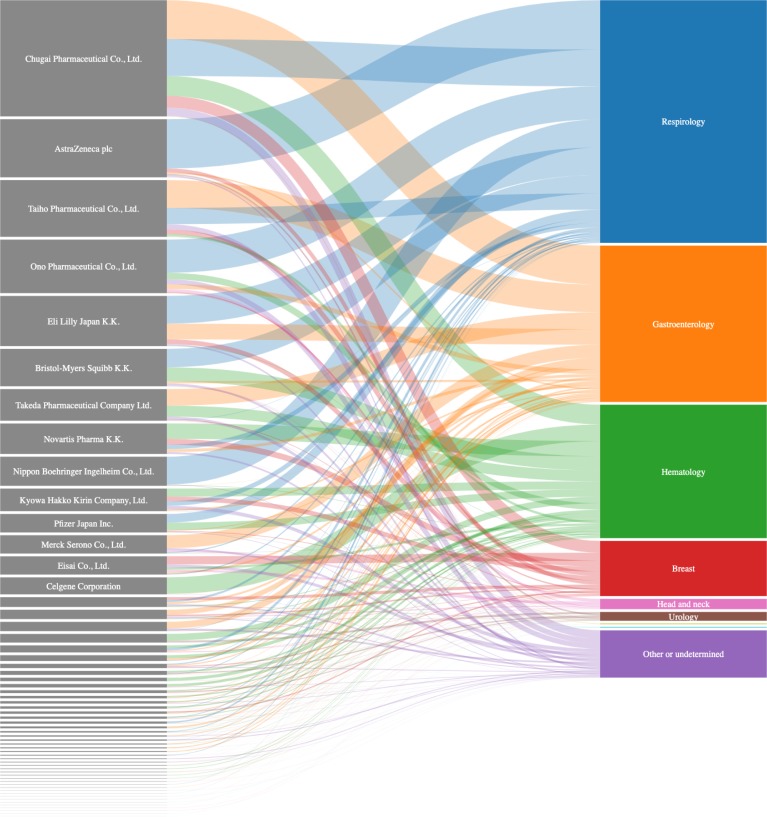
Figure 1.
Distribution of payments to each subspecialty on an individual company basis. The companies and specialties are sorted in descending order with regard to payment value (proportionally expressed in the box height and band width in figure 1). Band colour represents the payment destination specialties. Due to space limitations, names of companies with payment values of less than 10 million yen (£67 700, €80 300 and $91 900) have been omitted.

