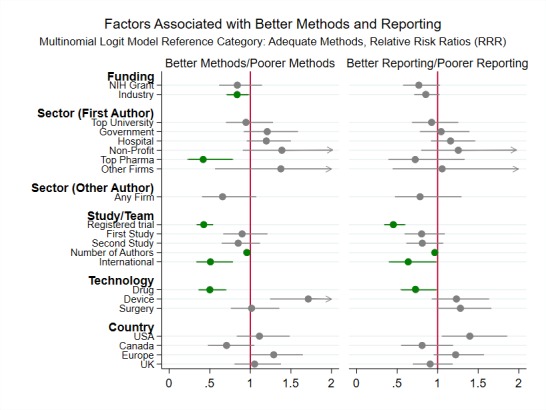
Figure 5.

Main regression results (relative risk ratios and 95% CIs) from the multinomial logit model predicting overall RCT quality. The arrow heads on the CIs indicate that the upper bound of the 95% CI is greater than 2. The dependent variable is a categorical variable and can take three values: adequate methods, inadequate methods and poor reporting. Adequate methods is the reference outcome category.The regression sample includes 11 686 RCTs with accessible full text. See figure 1 for more detailed information about the sample. The relative risk ratios represent the likelihood of an RCT with specific funding, sector, study/team, technology and country characteristics using inadequate methods (or being poorly reported), as compared with the likelihood of an RCT in a reference group without these characteristics using inadequate methods (or being poorly reported). In the regression, sector, technology and country are categorical variables. The omitted category for sector is other university. The omitted category for technology is other interventions. The omitted category for country is other countries. The regression includes topic and year fixed effects. The regression coefficients are reported in online supplementary table A2. Regression results predicting relative risk ratios for high or unclear risk of bias on each dimension assessed (as opposed to overall quality) are reported in online supplementary table A3. NIH, National Institutes of Health; RCT, randomised controlled trial.
