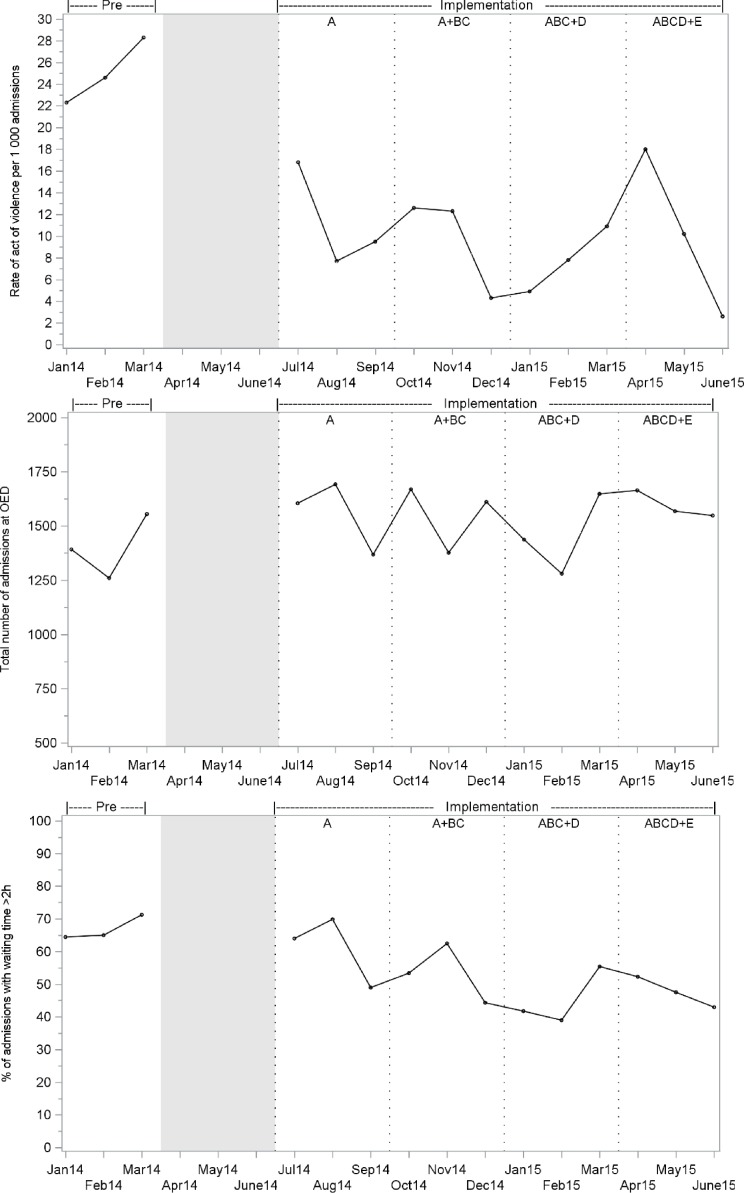
Figure 2.
Observed time series of the (A) rates of admission at OED with acts of violence, (B) total number of admissions at OED and (C) rates of admissions with waiting time greater than 2 hours, by month before and during implementation of the prevention programme. The grey band represents the 3-month training period. The dotted lines inside the scatter plots represents the implementation of component A (computerised triage algorithm), component BC (signage and messages broadcast on TV in the waiting rooms), component D (mediator) and component E (video surveillance). OED, ophthalmology emergency department.

