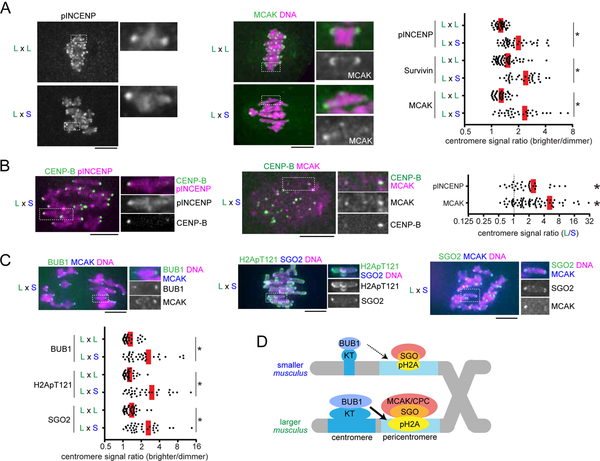
Figure 2. Selfish centromeres enrich more MT-destabilizing factors through the BUB1 pathway.
(A and C) CF-1 x CHPO (L x S) hybrid oocytes, or CF-1 x CF-1 (L x L) as controls, were fixed at metaphase I and stained for phosphorylated INCENP, Survivin, MCAK, BUB1, H2ApT121, or SGO2. Graph shows centromere signal ratios, calculated as the brighter divided by the dimmer signal for each bivalent (n > 32 for each condition); red line, mean; *P < 0.001. (B) CF-1 x CHPO hybrid oocytes expressing CENP-B-EGFP were stained for pINCENP or MCAK. Graph shows centromere signal ratios, calculated as the CF-1 centromere divided by the CHPO centromere signal for each bivalent. Each dot represents a single bivalent (n > 31 for each condition); red line, mean; *P < 0.001, indicating significant deviation from 1. Images (A-C) are maximum intensity z-projections showing all chromosomes (left), or optical slices magnified to show single bivalents (right); scale bars, 10 μm. (D) Model of the amplified BUB1 pathway in larger centromeres compared to smaller centromeres in the intraspecific CHPO hybrid.

