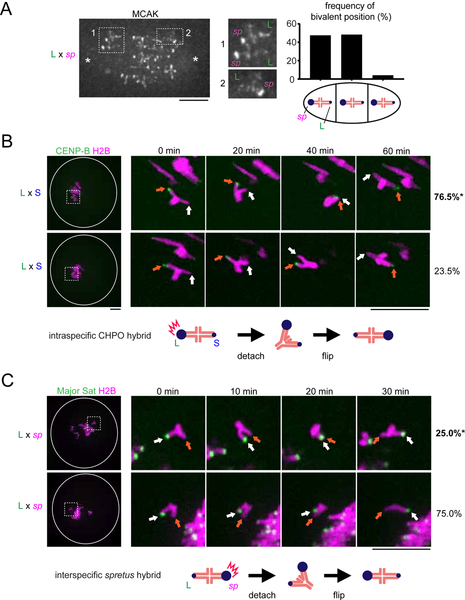
Figure 6. Relative MCAK levels on centromeres predict their destabilizing activity.
(A) C57BL/6J x SPRET/EiJ (L x sp) oocytes were fixed at metaphase I and stained for MCAK. Images are maximum intensity z-projections showing all chromosomes or optical slices magnified to show two bivalents closer to the left pole (1) or a single bivalent closer to the right pole (2). Schematic shows bivalent positions as equidistant between the two poles (middle) or off-center with either the spretus centromere or the larger musculus centromere closer to the pole. The frequency of each case is plotted (n = 120 bivalents). (B) CF-1 x CHPO (L x S) oocytes expressing CENP-B-mCherry and H2B-EGFP were imaged live. Time-lapse images show examples of flipping events, which were analyzed to determine the frequency of either the larger (orange arrows) or smaller (white arrows) musculus centromere moving first to initiate flipping (top and bottom panels respectively). Percentages on the right indicate frequency of each case (n = 45 flipping events from 61 cells). (C) CF-1 x SPRET/EiJ and C57BL/6J x SPRET/EiJ (L x sp) oocytes expressing Major Sat. TALE-mClover and H2B-mCherry were imaged live and analyzed to determine whether the larger musculus (white arrows) or spretus (orange arrows) centromere initiates flipping (top and bottom panels respectively) (n = 27 flipping events from 20 cells). Images (B, C) are maximum intensity z-projections showing all chromosomes (left), or optical slices magnified to show flipping events (timelapse). White circle indicates the cell outline. Schematics show the more frequent flipping events, with relative MCAK levels indicated by the size of the blue circle. Scale bars, 10 μm; *P < 0.05, indicating significant deviation from 50%.

