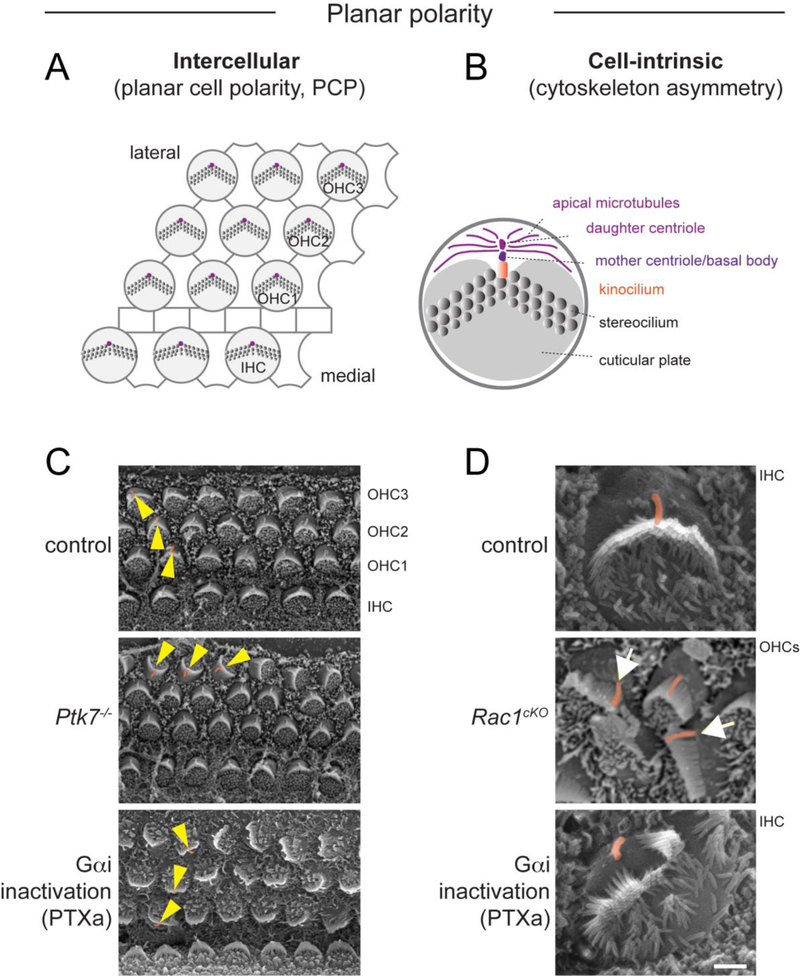
Figure 1. Two levels of planar polarity in the organ of Corti.
A) Diagram depicting tissue-level, intercellular planar cell polarity (PCP), manifested by the uniform orientation of HCs along the medial-lateral axis of the cochlear duct. PCP is regulated by intercellular communication through asymmetric core PCP protein complexes at HC-SC junctions. B) By contrast, cell-intrinsic planar polarity refers to cytoskeleton asymmetry along the planar axis in individual HCs. Different structures displaying intracellular planar polarity are indicated. This behavior involves protein modules acting cell-intrinsically. C) Scanning electron microscopy (SEM) images showing PCP defects in representative mouse mutants. Yellow arrowheads indicate OHC orientation. D) SEM images showing cell-intrinsic planar polarity defects in representative mouse mutants. The kinocilium is highlighted in orange. Note OHCs in Rac1 mutants with off-center kinocilium relative to an abnormally flat hair bundle (arrows). PTXa mutants show IHCs where the kinocilium is disconnected from a split hair bundle. Ptk7 mutants strictly exhibit orientation (PCP) defects, whereas Rac1 and PTXa mutants exhibit both orientation and cell-intrinsic planar polarity defects. PTXa mutants have Cre-induced expression of the catalytic subunit of Pertussis toxin (PTXa) in HCs. Ptk7 and Rac1 SEM images are modified from [36, 66].

