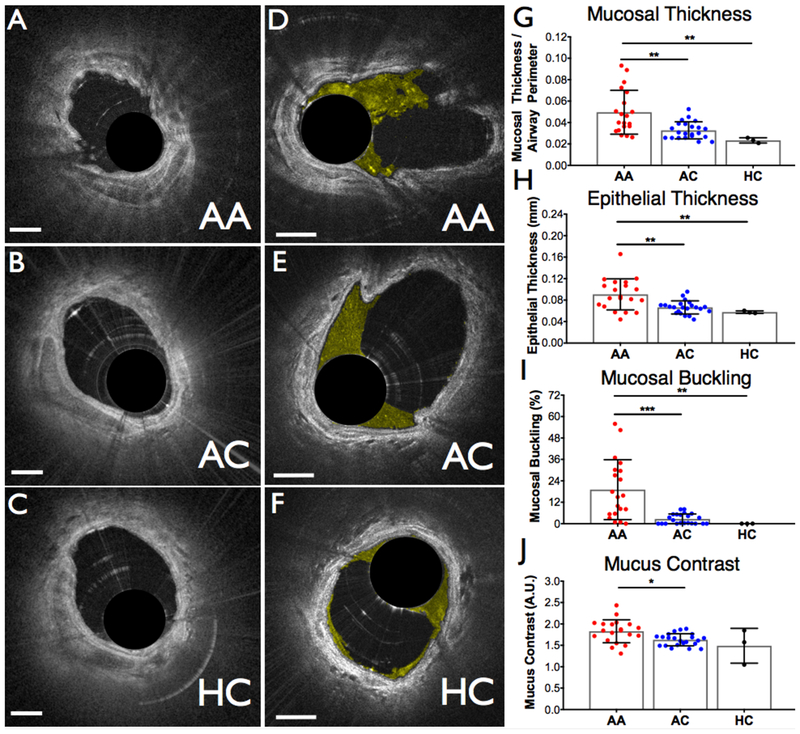
Figure 2.
Representative cross-sectional images comparing pre-challenge airway wall morphology (a-c) and mucus (d-f) for the three groups included in the study. Mucus was color-coded in yellow. (a,c) Allergic asthmatic, (b,e) allergic controls, and (c,f) healthy controls. (g-j) Airway morphology and mucus metrics measured pre-challenge for each of the three groups. (g) Mucosal thickness, (h) epithelial thickness, (i) percentage of frames exhibiting mucosal buckling, and (j) mucus contrast. AA, allergic asthmatic; AC, allergic control; HC, healthy control; A.U, arbitrary units. Scale bars, 1 mm. * p < 0.05, * p < 0.01, *** p < 0.001.

