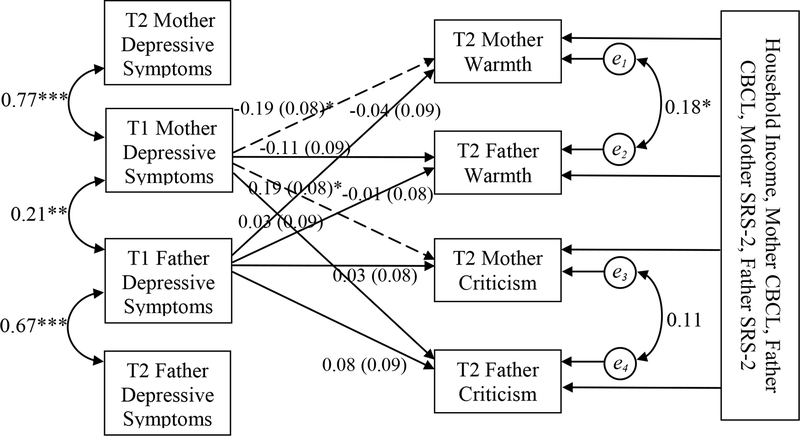
Figure 2.
Path diagram and estimates for the actor-partner interdependence model of depressive symptoms on mother and father Warmth and Criticism including household income and mother and father SRS-2 (Social Responsiveness Scale – Second Edition) and CBCL (Child Behavior Checklist) ratings as covariates. Single-headed arrows indicate predictive paths; double-headed arrows indicate correlated variables. Dashed lines indicate significant predictive path. p-value = * > 0.05; ** > 0.01; *** > 0.001. Fit statistics: χ2 (df) = 100.18(20), RMSEA = .15, TLI = .42, CFI = .74.

