
Figure 3.
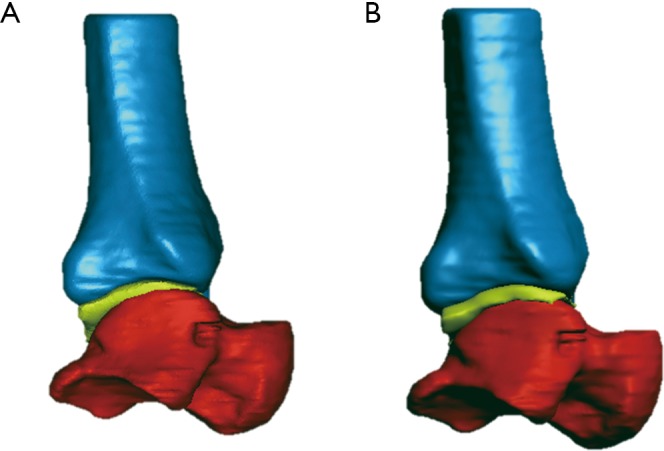
Exemplary results of multi-modal model registration, via SVD (A) and via ICP (B). The bone models of the talus (in red) and tibia (in blue) are depicted together with the model (in lemon-green) of the single tibiotalar articular cartilage. SVD, singular value decomposition; ICP, iterative closest point.