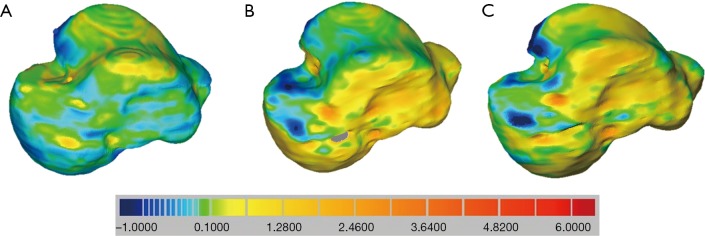
Figure 4.
Results from the distance map analysis, after bone-to-bone registration via SVD: STCT-DECT (A); DECT-CBCT (B); STCT-CBCT (C). Colour-map is from maximum penetration (−1 mm, in blue) to maximum separation (6 mm, in red) passing for a best matching (in green), as for the colour scale. SVD, singular value decomposition; STCT, standard CT; DECT, dual energy CT; CBCT, cone-beam CT; CT, computed tomography.

