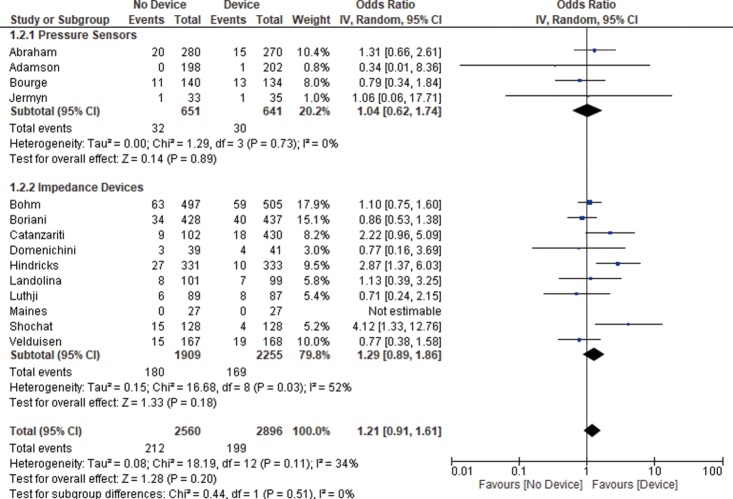
Figure 2.
All-cause mortality. The measure of effect of device versus control group on all-cause mortality rate of each study was plotted using OR and 95% CI on a forest plot. The overall results and subgroup analysis showing no statistically significant difference between both groups. OR, odds ratio; CI, confidence interval.

