Figure 2:
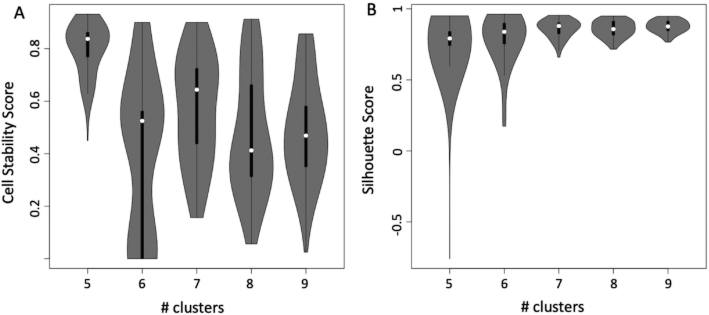
Cell stability score vs silhouette score calculated on the dataset of Pace et al. [24] (see Supplementary file section 8) using SIMLR over a set of number of clusters ranging between 5 and 8. A, Cell stability score violin plot. Mean value and data dispersion suggest that the best number of clusters is 5. Cells remain in the same cluster ∼80% of the time, repeating the clustering upon random removal of 10% of the cells. B, Silhouette score (SS) violin plot. Mean value of the SS distribution does not provide clear evidence that one clustering condition is better than another. Furthermore, the dispersion of the SS value shrinks as the number of clusters increases.

