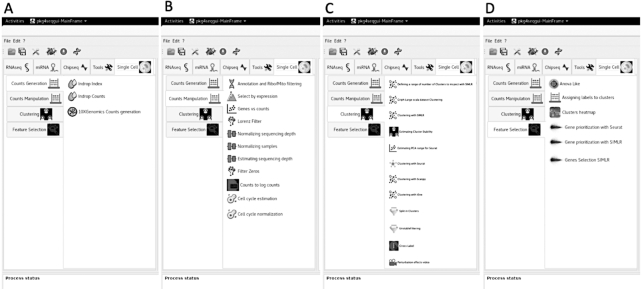
Figure 4:
rCASC graphical interface within 4seqGUI. A, Count table generation menu: this set of functions is devoted to the conversion of fastq to a count table. B, Count table manipulation menu: this set of functions provides inspection, filtering, and normalization of the count table. C, Clustering menu: these functions allow the use of SIMLR, t-SNE, Seurat, griph, and scanpy to group cells in subpopulations. D, Feature selection menu: this set of functions allows the identification of cluster-specific subsets of genes and their visualization using heat maps.

