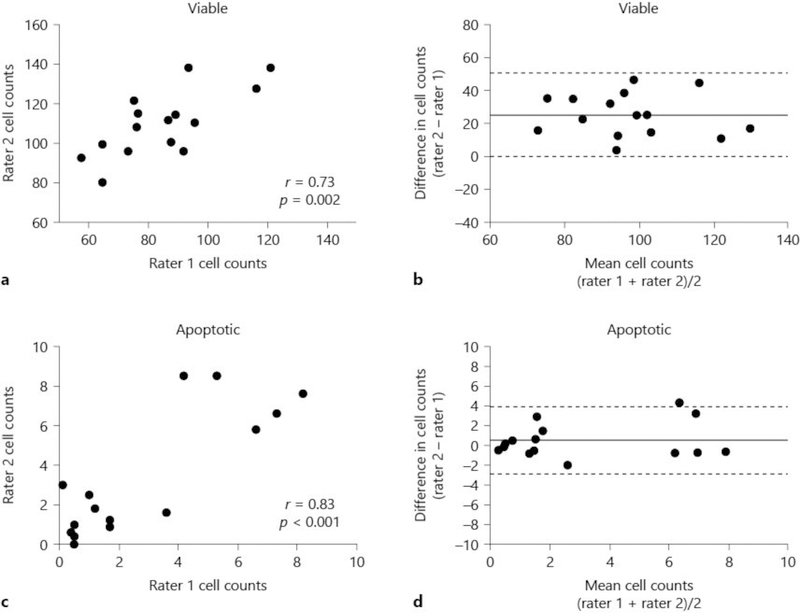
Fig. 3.
Interrater reliability for counting viable neurons (a, b) and apoptotic profiles (c, d) on hematoxylin and eosin (H&E)-stained sections in putamen of 15 random piglets. Two investigators counted cells in different microscope fields of the same pig. Viable neuron counts (a; r = 0.73, p = 0.002) and apoptotic profile counts (c; r = 0.83, p < 0.001) correlated between the investigators. Bland-Altman plots for viable neurons (b) and apoptotic profiles (d). Bias is shown by the solid line. The 95% limits of agreement are shown by dotted lines. The apoptotic counts had near-zero bias, whereas bias was higher for viable neuron counts.

