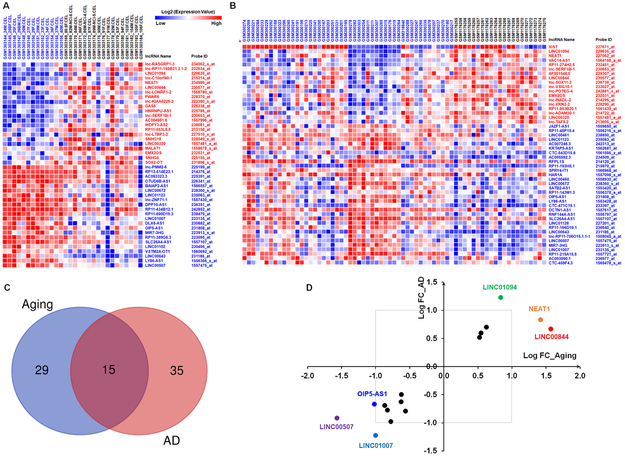
Figure 1. Common lncRNA expression patterns in the frontal cortices of aged and AD individuals.
A Heat map showing microarray data (GSE53890) for the up- and down-regulated lncRNAs in the frontal cortices of aged individuals (age ≥ 80; n = 17) compared with that in young individuals (age ≤ 40; n = 13). B Heat map showing microarray data (GSE48350) for the up- and down-regulated lncRNAs in the frontal cortices of individuals with AD (n = 21) compared with that in individuals with no disease (nd; n = 48). C Venn diagram illustrating the overlap of 15 lncRNAs that were altered (∣log2 (Fold Change)∣ > 0.5; p < 0.05) by both aging and AD. D Scatter plot illustrating the 15 overlapping lncRNA genes showing log2 of fold change by AD (x-axis) against log2 of fold change with aging (y-axis). The upper right quadrant represents 6 lncRNAs that were increased with both aging and AD. Conversely, the lower left quadrant illustrates 9 lncRNAs that were decreased by both aging and AD.

