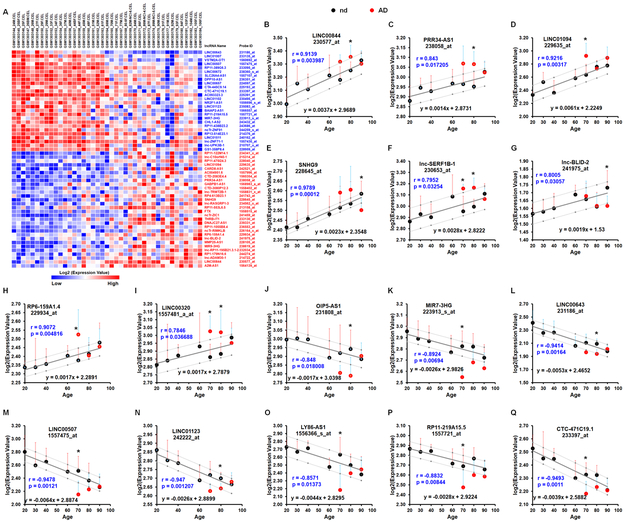
Figure 2. Abnormal alteration of age-associated lncRNAs in the frontal cortices of AD patients.
A Heat map representation of microarray data (GSE53890) for age correlated lncRNAs (∣r∣ > 0.5; p < 0.05; Pearson’s test). Blue and black colors indicate lncRNAs that are negatively and positively associated with age, respectively. B - Q Relative alterations of indicated lncRNAs in the frontal cortices of individuals with no disease (nd; black dots) and AD (red dots) during aging. Bars indicate SD; r and p values were obtained by Pearson’s correlation and are shown within the graphs. The black dots with error bars denote means for expression levels of indicated lncRNAs in the frontal cortices of individuals with nd in each age group (20: [age ranging 20-29, n=7]; 30: [30-39, n=5]; 40 [40-49, n=9]; 60: [52-69, n=5]; 70: [70-79, n=8]; 80: [80-89, n=6]; and 90 [90-99, n=10]). The red dots with error bars denote means for expression levels of indicated lncRNAs in the frontal cortices of individuals with AD in each age group (70: [70-79, n=3]; 80: [80-89, n=8]; and 90: [90-99], n=8). The solid line shows the expression trend of indicated lncRNA in the frontal cortices during normal aging. Pearson correlation coefficients (r) and p values are shown in the graphs. The dotted lines show the 95% prediction interval of linear regression analysis calculated from the data (GSE48350). P-values were calculated using Two-tailed Unpaired t-test where: *P < 0.05 vs the same age group.

