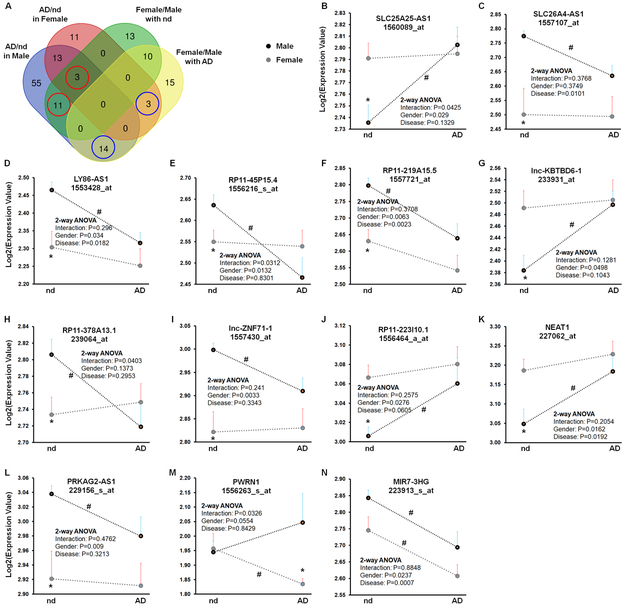
Figure 3. Dysregulated gender-associated lncRNAs in the frontal cortices of AD patients.
A Venn graph summarizes the number of common and unique lncRNAs (dataset GSE48350) identified in the four comparisons: Female (n = 24) vs. Male (n = 24) in individuals with no disease (nd), Female (n =12) vs. Male (n = 7) in AD patients, Female with AD vs. Female with nd and Male with AD vs. Male with no disease. B - N Relative expression of indicated lncRNAs in the frontal cortices of male (black dots) and female (gray dots) individuals with and without AD (GSE48350). To avoid age bias, a total of 43 subjects, age ranging from 70 to 99, (9 males and 13 females with nd; 7 males and 14 females with AD), were selected for this analysis. Bars indicate SEM. P-values were calculated using Two-tailed Unpaired t-test where: *P < 0.05 vs male in the same disease status; # P < 0.05 vs nd in the same gender. Results of Two-Way ANOVA are given within the graphs.

