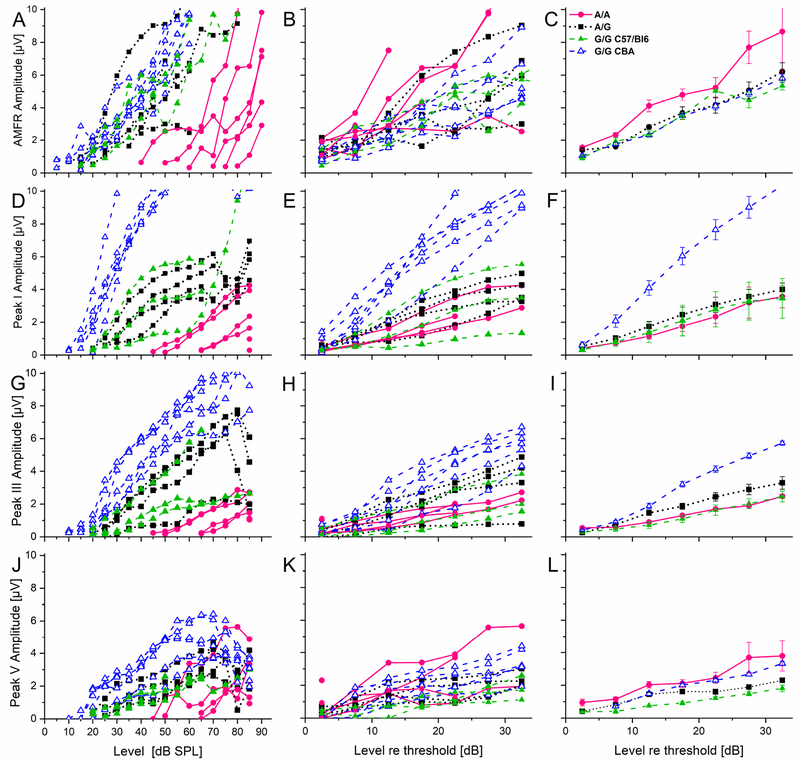
Figure 6. Amplitude growth functions of different auditory structures show both a genotype and strain dependent phenotype at one year of age.
Left column shows individual amplitude growth functions plotted for stimulus intensity in dB SPL. Middle column shows the growth functions as in the left column plotted for stimulus level respective to threshold (up to 35 dB above threshold). Right column shows the average group data of the corresponding plot in the middle column. B, C, The AMFR growth functions of the one year-old cohort show a significant influence of genotype with the A/A mice having the highest amplitudes. E, F, A significant strain dependent difference can be observed for ABR wave I, but no difference between the different C57Bl/6 mice. H, I, For ABR wave III again the CBA/CaJ mice showed a steeper growth curve than all other mice. K, L, For peak V the CBA/J mice show a steeper growth function than both the homozygous G/G C57Bl/6 mice and the heterozygous C57Bl/6 animals, while there was no difference to the homozygous A/A mice. Animal numbers, stimulation parameters, color codes and symbols as in Figure 5. For the statistical results see Appendices Table A4–1 (2-way ANOVA), Table A4–2 (Scheffe test for post-hoc comparison excluding CBA/J mice) and Table A4–3 (Scheffe test including CBA/J mice).

