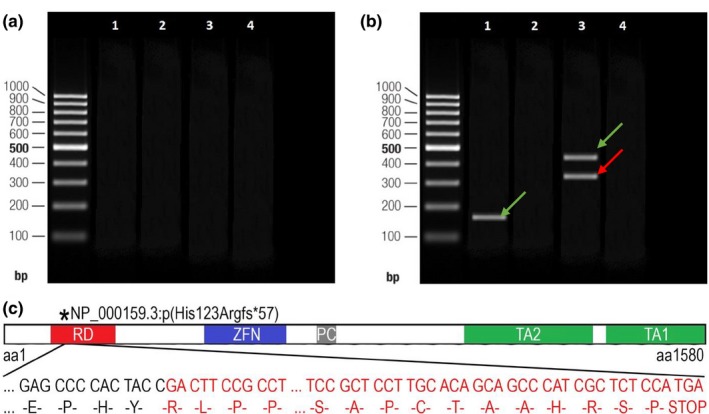
Figure 2.

Polymerase chain reaction (PCR) amplifications of patient II‐3's cDNA to verify the splice site NC_000007.14(NM_000168.6):c.473+3A>T variant of the GLI3 visualized on agarose gel and the consequences of this variant. (a) Lanes 1–2 show the results of the amplification of amplicon #3 of cDNA synthesized from the RNA sample extracted from patient II‐3's total blood sample. Lanes 3–4 correspond to the amplification of amplicon #3 performed on the blood cDNA of the healthy control individual without c.473+3A>T variant (control sample). Lanes 2 and 4 correspond to the PCR reaction products of negative control. A 100 bp DNA ladder was used as the size marker. (b) Lanes 1–4 show the results of the amplification of cDNA synthesized from the RNA sample that was extracted from patient II‐3's fibroblast cell line. Lane 1 shows one band corresponding to a shorter amplicon (#3) of wild type allele of patient II‐3's cDNA sample (166 nt); lane 3 shows the two bands derived from the amplification of the cDNA of patient II‐3 (313 nt and 419 nt reflecting normal and mutated alleles [amplicon #4]); and lanes 2 and 4 correspond to the PCR reaction products of negative control. The green arrow indicates the amplicon of the wild type allele, while the red one indicates the amplicon of the mutated allele. (c) A schematic view of the truncated GLI3 protein and its functional domains (part of the frameshifted sequence of exon 5 has been omitted for clarity): the red square indicates the repressor domain (RD; aa106‐aa263), the blue square indicates the zinc finger domain (ZFN; aa462‐aa645), the gray square indicates the proteolytic cleavage site (PC; aa703‐aa740), and green squares indicate both transactivation domain 2 (TA2; aa1044‐aa1322) and transactivation domain 1 (TA1; 1376‐aa1580; according to Ito et al., 2018)
