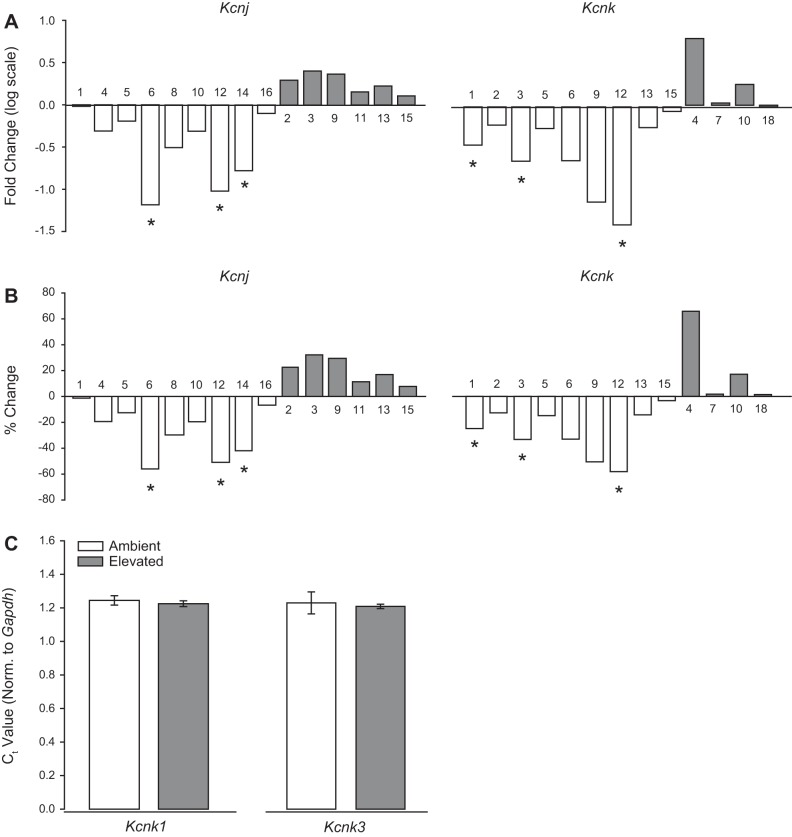
Fig. 1.
Ocular hypertension alters RNA expression of K+ channels in vivo. RNA sequencing was performed on whole retina from saline- and microbead-injected eyes. A: box plots of fold change (log scale) of expression change between saline and microbead retinas from the Kcnj (left) and Kcnk (right) gene families. B: box plots of percentage of expression change between saline and microbead retinas from the Kcnj (left) and Kcnk (right) gene families. n(PBS) = 5 retinas; n(MOM) = 5 retinas. C: quantitative RT-PCR was performed on RNAs isolated from primary, purified cultures of Müller glia exposed to ambient or elevated pressure for 48 h. Bar graphs of mean threshold cycle (Ct) values normalized to Gapdh, compared between ambient and elevated pressure for Kcnk1 (left) and Kcnk3 (right). n = 3 for all. *P < 0.05. MOM, microbead occlusion model.

