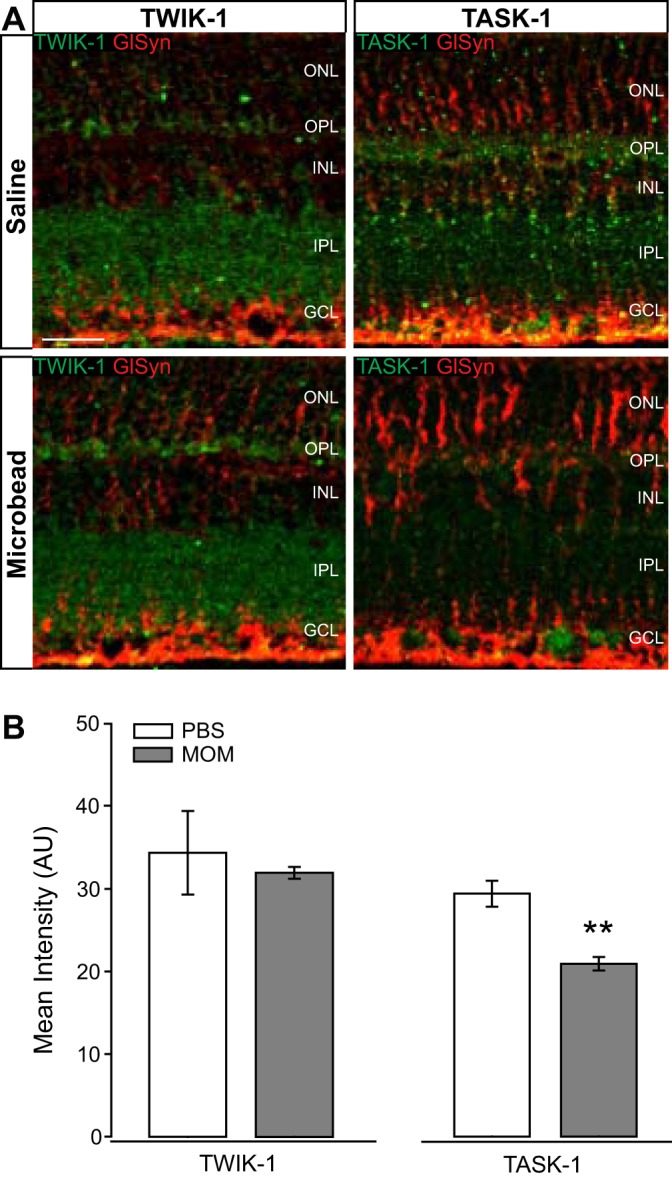
Fig. 4.

Intensity of TWIK-1 and TASK-1 channel staining in glaucomatous retinal sections. A: representative fluorescent micrographs of retinal sections from saline- or microbead-injected eyes. Immunolabeling of TWIK-1 (green), TASK-1 (green), and CD44 (red) was performed. B: bar graphs of the mean intensity of TWIK-1 and TASK-1 staining compared between saline and microbead retina. TWIK-1: n(PBS) = 6 retina sections; n(MOM) = 7; TASK-1: n(PBS) = 7; n(MOM) = 7. Images taken at ×40; scale bar = 20 µm. Student’s t-test was used to analyze statistical significance. **P < 0.005. MOM, microbead occlusion model.
