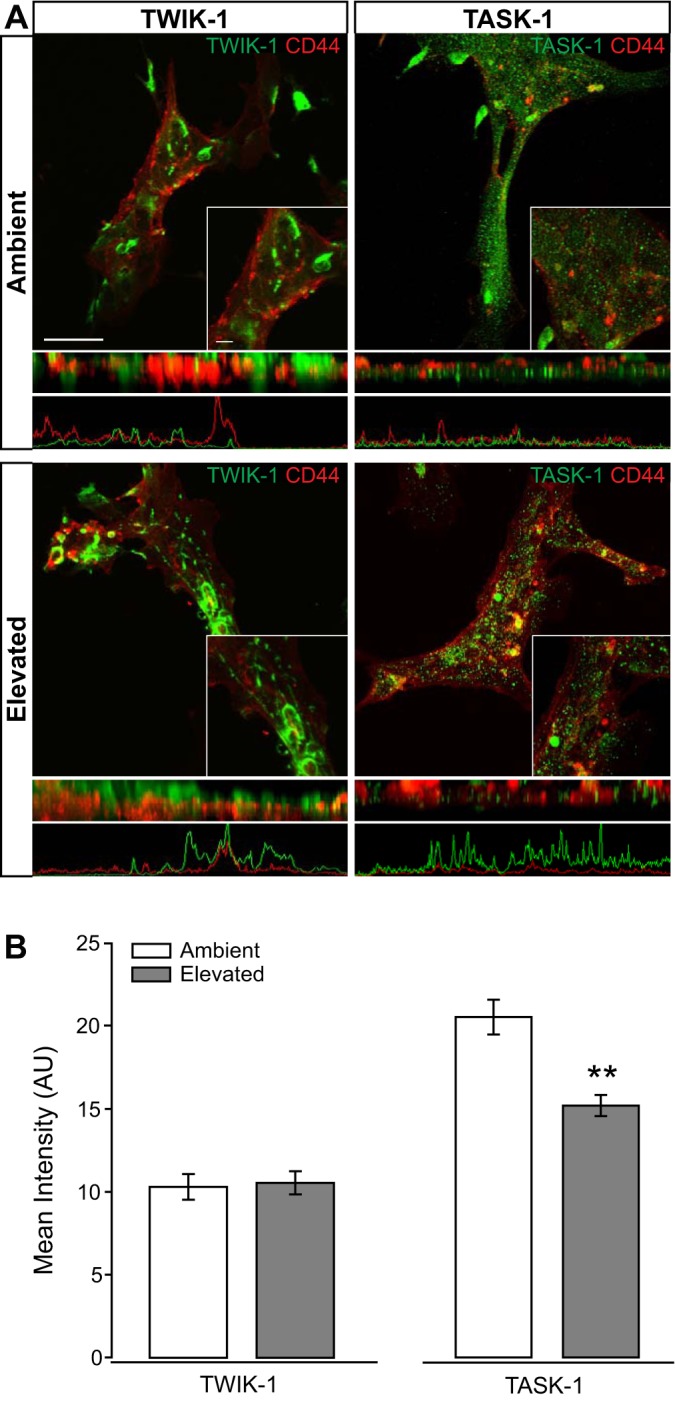
Fig. 5.

Intensity of TWIK-1 and TASK-1 channel staining in Müller glia cultures following pressure elevation. Primary, purified cultures of Müller glia were exposed to ambient (Amb) or elevated (Elev) pressure for 48 h. A: representative fluorescent micrographs of Müller glia from each condition. Immunolabeling of TWIK-1 (green), TASK-1 (green), and CD44 (red) was performed. Panels directly below the fluoromicrographs are a z-plane view of the image, with associated plot of fluorescent intensity. B: bar graphs of the mean intensity of TWIK-1 and TASK-1 staining compared between ambient and elevated pressure. TWIK-1: n(Amb) = 22 cells; n(Elev) = 13; TASK-1: n(Amb) = 21; n(Elev) = 22. Images taken at ×60; scale bar = 40 µm. Inset taken at ×60 + ×2.5 zoom; scale bar = 10 µm. Student’s t-test was used to analyze statistical significance. **P < 0.005.
