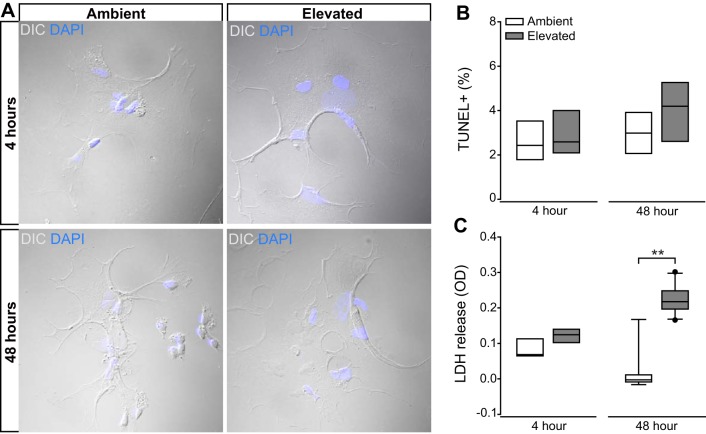
Fig. 8.
Effect of short- and long-term pressure elevation on Müller glia cell health. Primary, purified cultures of Müller glia were exposed to ambient (Amb) or elevated Elev) pressure for 48 h. A: representative DIC micrographs of Müller glia from each condition. B: bar graphs of the percentage of TUNEL-positive Müller glia compared between each condition. n = 4 wells per condition (combined 5 images at ×20/well). C: bar graphs of the amount of lactate dehydrogenase (LDH) released in the Müller glia culture media compared between each condition. n(Amb 4 h) = 5 wells; n(Elev 4 h) = 5; n(Amb 48 h) = 15; n(Elev 48 h) = 17. Student’s t-test was used to analyze statistical significance. **P < 0.001.

