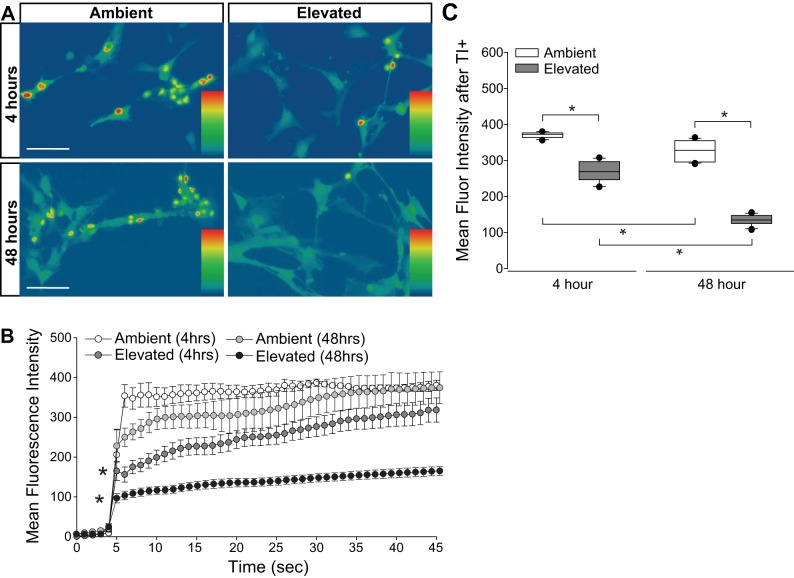
Fig. 10.
Cation channel activity in Müller glia exposed to elevated pressure. Primary, purified cultures of Müller glia were exposed to ambient (Amb) or elevated (Elev) pressure for 4 or 48 h. A: representative heat map showing the fluorescent signal of Thallos dye in Müller glia from each condition. Images were taken after the addition of thallium. B: line graphs displaying the normalized fluorescence intensity of Thallos dyes over time for each condition. Student’s t-test was used to analyze statistical significance. C: box plots of the average fluorescence intensity following addition of thallium compared between each condition. One-way ANOVA with pairwise comparison by Dunn’s method was used to analyze statistical significance. n(Amb 4 h) = 5 cells; n(Elev 4 h) = 12; n(Amb 48 h) = 5; n(Elev 48 h) = 18. *P < 0.05.

