
Fig. 11.
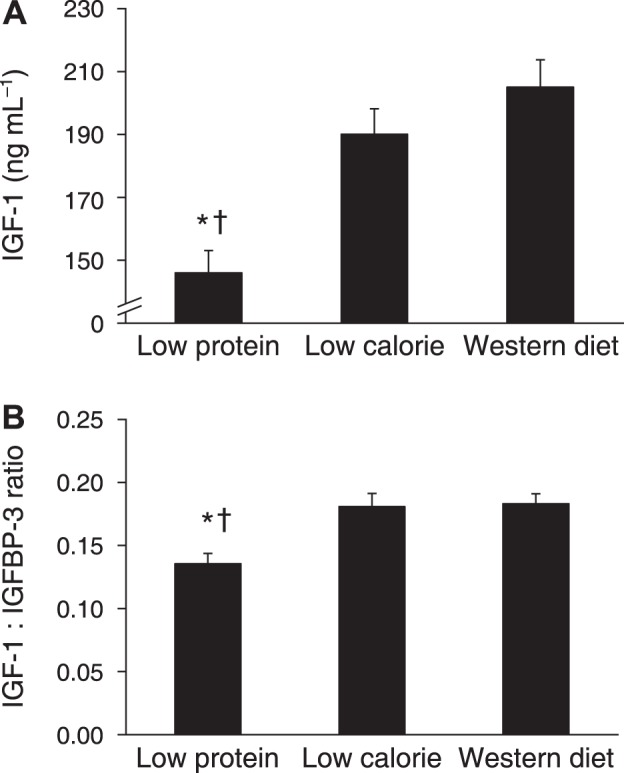
Long-term effects of caloric restriction and protein restriction on serum IGF-1 concentration (A) and the ratio of IGF-1 to IGFBP-3 concentrations (B). Data from the cross-sectional comparison of individuals who were habitually consuming a low-protein diet, a low-calorie diet, or a typical Western diet. Data are means SE. *P ≤ 0.01 vs. the low-calorie group. †P ≤ 0.01 vs. the Western diet group. [Reproduced from Fontana et al. (50) under Creative Commons Attribution License 4.0.]