Fig. 5.
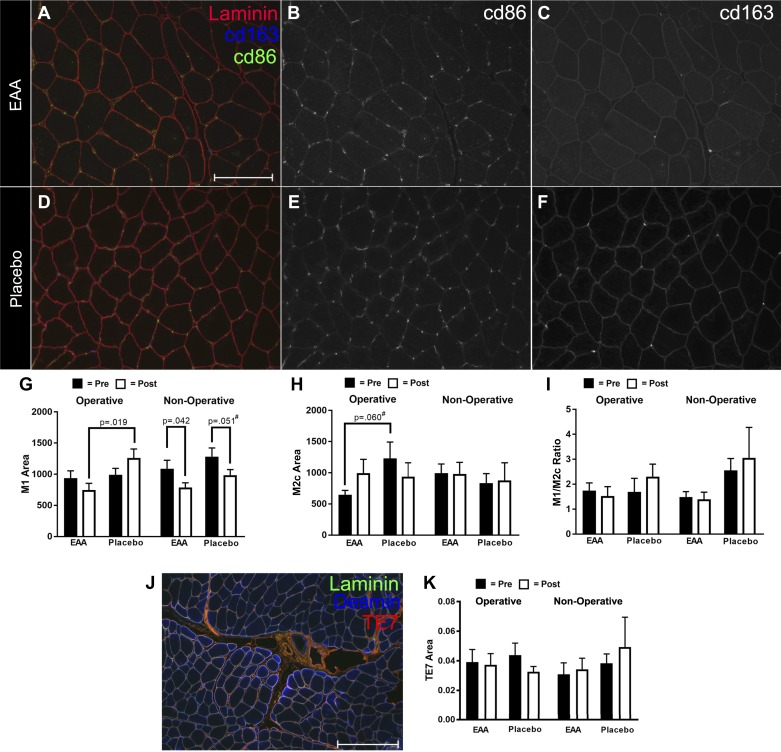
Macrophage content in vastus lateralis tissue of study patients. Representative images of tissue sections from EAA (A–C) and Placebo (D–F) study subjects. Scale bar indicates 150 µm. In A and D, M1 macrophages are labeled with anti-cd86 (green). M2c macrophages are labeled with anti-cd163 (blue). The extracellular matrix is labeled with anti-laminin2 (red). In B and E, cd86-positive staining is shown. In C and F, cd163 is shown. G: histogram showing the changes in M1 area normalized to the area of the extracellular matrix marked with laminin. Black bars indicate average area of the baseline time point, and white bars indicate the combined average of the 1- and 2-wk time points. H: histogram showing the changes in M1 area normalized to the area of the extracellular matrix marked with laminin. Black bars indicate the average area of the baseline time point, and white bars indicate the combined average of the 1- and 2-wk time points. I: ratio of M1 to M2c. J: representative image used for assessment of fibrotic tissue, with TE7 (red), desmin (blue), and laminin (green). K: histogram showing measurements of TE7 area in the various experimental conditions. *Significance (P) values represent the treatment group main effect in separate analyses of (co)variance. Presurgery values were covaried in models evaluating postsurgery treatment group differences. Values denoted with a # symbol trended toward significance (had a P value between 0.051 and 0.099).

