Fig. 6.
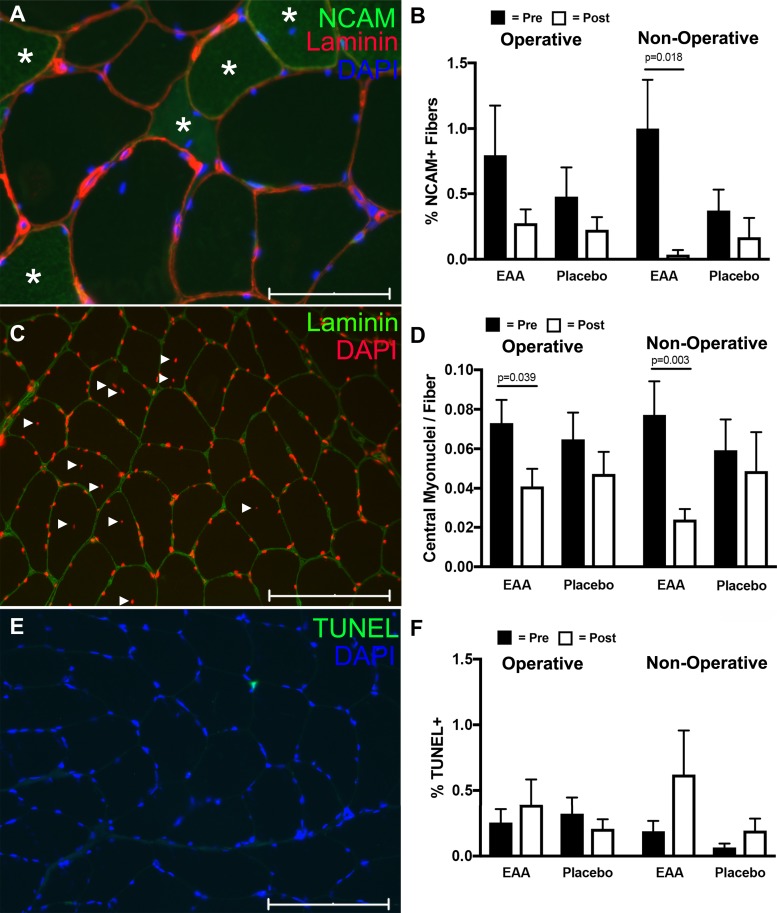
NCAM+ fibers, TUNEL and central nuclei assessment in vastus lateralis biopsies of study subjects. A: representative image of NCAM+ fibers (green; positive fibers are marked with an *). The image is costained with laminin (red) and DAPI (blue). Scale bar is 75 µm. B: histogram showing NCAM+ fibers in the various experimental conditions. C: representative image used for determining central nuclei number. Nuclei are labeled with DAPI (red) and laminin (green) marks the extracellular matrix. Solid triangles indicate central myonuclei. Scale bar is 150 µm. D: histogram showing central nuclei distribution in the various experimental conditions. E: TUNEL-positive cell (green) counterstained with DAPI (blue). Scale bar is 150 µm. F: histogram showing the distribution of TUNEL cells across the experimental conditions. *Significance (P) values represent the treatment group main effect in separate analyses of (co)variance. Presurgery values were covaried in models evaluating postsurgery treatment group differences.

