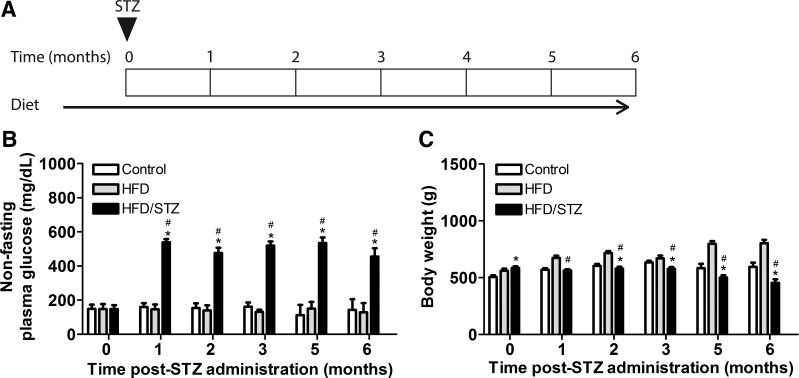
Fig. 1.
Timeline and general characteristics of the high-fat diet (HFD)/streptozotocin (STZ) model over a duration of 6 mo. A: HFD/STZ model timeline. The triangle indicates the timing of STZ intraperitoneal injections. Rats were randomly assigned into control, HFD, or HFD/STZ groups. After 1 mo of the assigned diet, the HFD/STZ group received two low-dose STZ injections (30 mg/kg) 1 wk apart. All experimental groups were maintained through 6 mo after STZ injections. B: nonfasting plasma glucose (in mg/dl) was measured in age-matched control, HFD, and HFD/STZ rats. The HFD/STZ group exhibited significant increases in nonfasting plasma glucose compared with both age-matched control and HFD groups from 1 to 6 mo after STZ. C: body weight (in g) was measured in the age-matched control, HFD, and HFD/STZ groups. Both HFD and HFD/STZ groups had increased body weight compared with the control group at the time of STZ injections. From 1 to 6 mo after STZ, the HFD group exhibited a significant increase in body weight, whereas the HFD/STZ group exhibited a significant decrease, compared with the control group. Statistical comparisons were made using two-way repeated-measures ANOVA and a Bonferroni posttest. *P ≤ 0.05 compared with the control group; #P ≤ 0.05 compared with the HFD group. Values are means ± SE of 12–20 animals from 1–4 mo after STZ and 3–7 animals from 5–6 mo after STZ. Measurements were taken 1 day per month.

