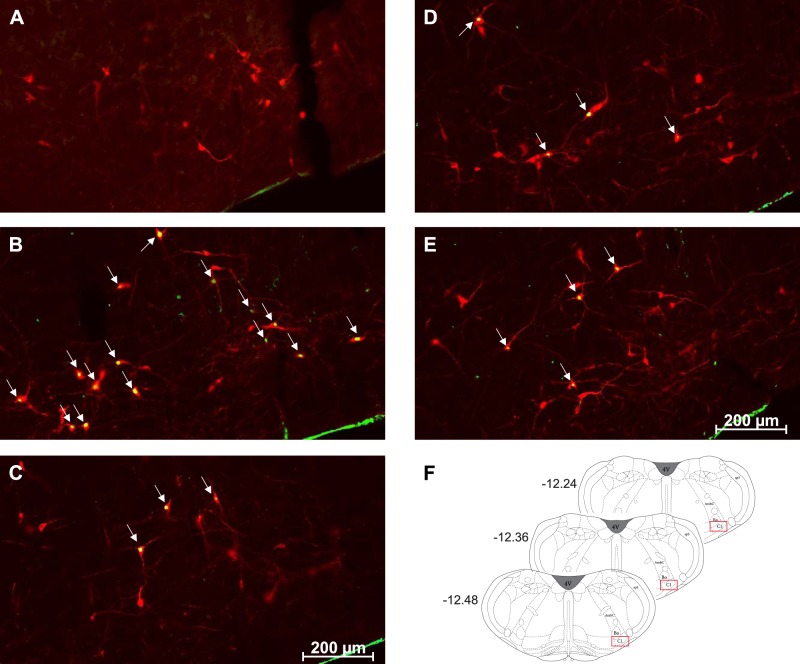
Fig. 3.
Representative images (×20) of treated C1 sections depicting Fos and phenylethanolamine-N-methyltransferase (PNMT) immunolabeling. A–E: representative photomicrographs (×20 magnification) of Fos (green) and PNMT (red) immunolabeling in the C1 medullary region of rat tissue (n = 4 animals/group). Cy3 fluorescence is pseudocolored red, and Alexa Fluor 488 is represented in green. Images represent staining in control (A), single-hypoglycemia (hypo) (B), repeated-hypo (C), hypo prevention (D), and naloxone-treated (E) animal tissue. Overlapping Fos+PNMT+ cells are indicated by arrows. F: bregma levels used for analysis. AmbC, ambiguus nucleus, compact part; Bo, Bötzinger complex; Sp5, spinal trigeminal nucleus; 4V, fourth ventricle.

